What Is Data-Driven Attribution?
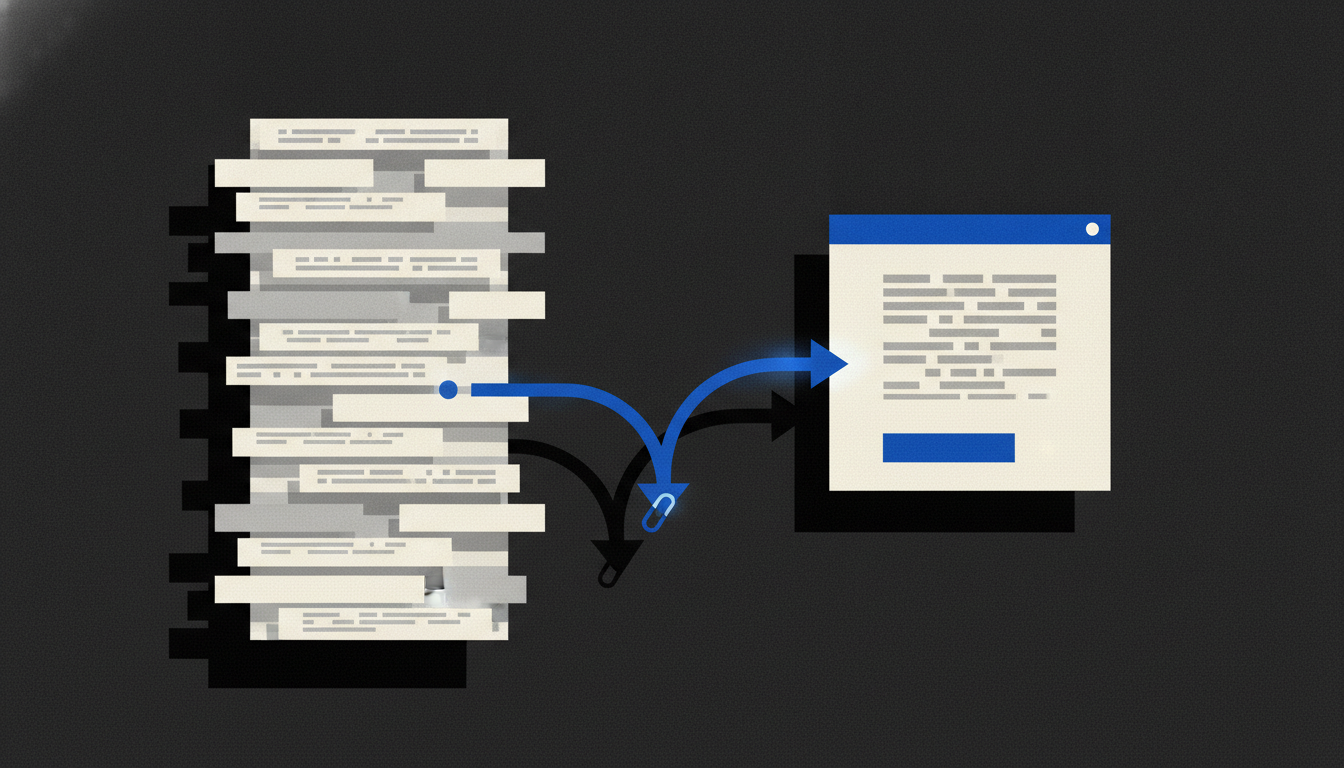
Data-driven attribution is an advanced marketing attribution model that uses machine learning to assign credit to different marketing touchpoints along a customer's conversion path. Unlike simpler models that give all credit to one touchpoint (like first or last click), data-driven attribution analyzes both converting and non-converting paths to determine the actual contribution of each marketing interaction. This model is the default for all conversion events in Google Analytics 4 (GA4) properties.
For small business owners, this is a significant advantage. Instead of guessing which marketing channels are most effective, Google's algorithms do the heavy lifting. The model evaluates how the presence or absence of a particular ad, click, or engagement impacts the probability of a conversion, providing a more accurate picture of your marketing ROI.
Understanding Attribution Models in GA4
Before diving into implementing data-driven attribution, it's crucial to understand the other models available and why data-driven is often the superior choice. GA4 offers several rule-based models, which assign credit based on simple, predefined rules. These models are still available for comparison in the Model Comparison report.
- Last-click attribution: Gives 100% of the conversion credit to the very last channel the customer clicked before converting. This model ignores all preceding interactions.
- First-click attribution: Gives 100% of the conversion credit to the first channel a customer interacted with. This highlights top-of-funnel channels but ignores what happens later.
- Linear attribution: Distributes conversion credit equally across all touchpoints in the path. If a customer interacted with a Facebook Ad, an email, and an organic search result, each gets 33% of the credit.
- Position-based attribution: Assigns 40% of the credit to the first touchpoint, 40% to the last touchpoint, and distributes the remaining 20% evenly among the middle touchpoints.
- Time-decay attribution: Gives more credit to touchpoints that happened closer in time to the conversion. An interaction one day before conversion gets more credit than one a week before.
While these models offer different perspectives, they are all based on assumptions. Data-driven attribution (DDA) removes the guesswork, making it the most sophisticated and accurate option for most businesses in 2026.
Data-Driven Attribution vs. Last-Click Attribution: A Comparison
Let's compare the default DDA model with the old industry standard, last-click attribution, to see why the switch is so important for ecommerce and B2B businesses.
Feature Data-Driven Attribution (DDA) Last-Click Attribution Credit Assignment Uses machine learning to assign fractional credit based on each touchpoint's actual contribution to conversion. Assigns 100% of the credit to the final click before conversion. Customer Journey View Provides a holistic view, valuing interactions at all stages of the funnel (awareness, consideration, decision). Provides a narrow view, only valuing the final, decision-stage interaction. Channel Valuation Accurately values top-of-funnel and mid-funnel channels (e.g., social media, display ads) that assist conversions. Systematically undervalues assisting channels and overvalues bottom-funnel channels (e.g., branded search, direct). Budget Optimization Enables smarter budget allocation by showing which channels truly drive incremental value. Can lead to poor budget decisions, like cutting funding for awareness campaigns that are actually crucial. GA4 Status Default attribution model for all new conversion events. Available for comparison but not the default reporting model.How to Implement Data-Driven Attribution in GA4
For most businesses using Google Analytics 4, the good news is that you don't need to "implement" data-driven attribution—it's already working for you. Since its full rollout, GA4 uses DDA as the default reporting attribution model for all properties. However, you need to ensure your setup is correct and know where to find and interpret the data.
Step 1: Verify Your Attribution Settings
First, confirm that your property is using the recommended settings. While DDA is the default, it's wise to check, especially if your property was migrated from Universal Analytics or has had multiple administrators.
- Navigate to your Google Analytics 4 property.
- Click on Admin in the bottom-left corner (the gear icon).
- In the Property column, click on Attribution Settings.
- Under Reporting attribution model, ensure that Data-driven attribution is selected. This setting applies to most of your reports, including the Conversions report.
- Review your Conversion window settings. The default "90 days" for acquisition conversion events is suitable for most businesses with longer sales cycles, while "30 days" for other conversion events works for shorter consideration periods. Adjust if necessary for your specific business model.
Step 2: Check Your Conversions
Attribution models only work if you are properly tracking conversions. A "conversion" is any user action that is valuable to your business, such as a purchase, a form submission, or a key content download.
- Go to Admin > Conversions.
- Review the list of events marked as conversions. Ensure that your most important user actions are listed here. For an ecommerce store, the `purchase` event is essential. For a B2B business, it might be a `generate_lead` custom event.
- If a key event is missing, find it in the Admin > Events list and toggle the switch to mark it as a conversion.
Your property needs to meet certain data thresholds for the DDA model to be fully trained, but Google has removed the strict conversion minimums that existed years ago. Most active business accounts will have sufficient data.
Step 3: Analyze Your Data in the Attribution Reports
Once you've confirmed your settings, you can analyze your marketing performance using GA4's attribution reports. These reports help you understand how users discover your business and what paths they take to convert.
Navigate to the Advertising section in the left-hand menu. This is your hub for attribution insights.
- Model Comparison: Found under Attribution > Model Comparison, this is the most powerful tool for seeing the impact of DDA. You can compare up to three models side-by-side (e.g., Data-driven vs. Last-click). Use this report to show stakeholders how last-click undervalues channels like Organic Social or Paid Search (non-brand). You will often see channels like "Email" or "Organic Social" receive significantly more credit under DDA than under last-click.
- Conversion Paths: Found under Attribution > Conversion Paths, this report visualizes the typical journeys customers take before converting. You can filter by conversion event and see which channels appear most frequently in the early, mid, and late stages of the path. This is invaluable for understanding how different channels work together.
Choosing the Right Attribution Model for Your Business
While DDA is the recommended default for over 95% of businesses, there are niche scenarios where a different model might be considered for comparison.
- B2B Marketing with Long Sales Cycles: DDA is ideal here. The customer journey can take months and involve dozens of touchpoints (webinars, whitepapers, demos, ads). DDA is the only model that can fairly distribute credit across this complex path. Comparing it with a Position-based model can also offer insights into what initiates and closes deals.
- Ecommerce Retail: DDA is also best for most retail businesses. It helps you value the social media ad that created initial awareness just as much as the branded search click that led to the final purchase. For stores focused on fast, impulse buys with short conversion paths, the difference between DDA and Last-click may be less dramatic, but DDA is still more accurate.
- Lead Generation with Short Cycles: For businesses where the journey from first touch to lead is very short (e.g., an emergency plumbing service), last-click might seem sufficient. However, DDA will still provide a more nuanced view, for instance, by giving some credit to a display ad that built brand recognition before the user made an urgent search.
The key takeaway is to start with data-driven attribution as your primary model. Use the other models in the Model Comparison report to gain different perspectives, not as your primary source of truth for reporting and budget allocation.
FAQs About Data-Driven Attribution
What is the difference between data-driven attribution and multi-touch attribution?
Data-driven attribution is a type of multi-touch attribution. "Multi-touch attribution" is a general category for any model that assigns credit to multiple touchpoints, including Linear, Position-based, and Time-decay. Data-driven is the most advanced form of multi-touch because it uses machine learning instead of fixed rules to assign that credit.
How long does it take for the data-driven model to learn?
The data-driven attribution model is always learning and refining itself based on your property's ongoing data. After enabling conversions, the model starts analyzing paths immediately. You can start trusting the data within a few weeks, and its accuracy will continue to improve as it collects more conversion and non-conversion data over time.
Can I use data-driven attribution for my B2B marketing?
Yes, absolutely. Data-driven attribution is particularly powerful for B2B marketing because of the typically long and complex customer journeys. It helps identify the value of top-of-funnel activities like blog posts, webinars, and social media engagement that a last-click model would completely ignore, leading to smarter investments in content and awareness campaigns.